 |
| i would have gotten stopped out this one a few times. short at 12, stopped on 1215. now the question is, do i get short again? if i did, i would have gotten stopped out around 2pm. if i didn't, maybe i would have taken the long at 1pm. what i am realizing, in order to make money and not get stopped out, you need to get at least 2 cycles or waves in your direction. take the 1pm long, you got an up move, slight retracment, and then a move up again. a nice exit signal or a place to move your stops up to. |
 |
| gorgeous |
 |
| another beauty |
 |
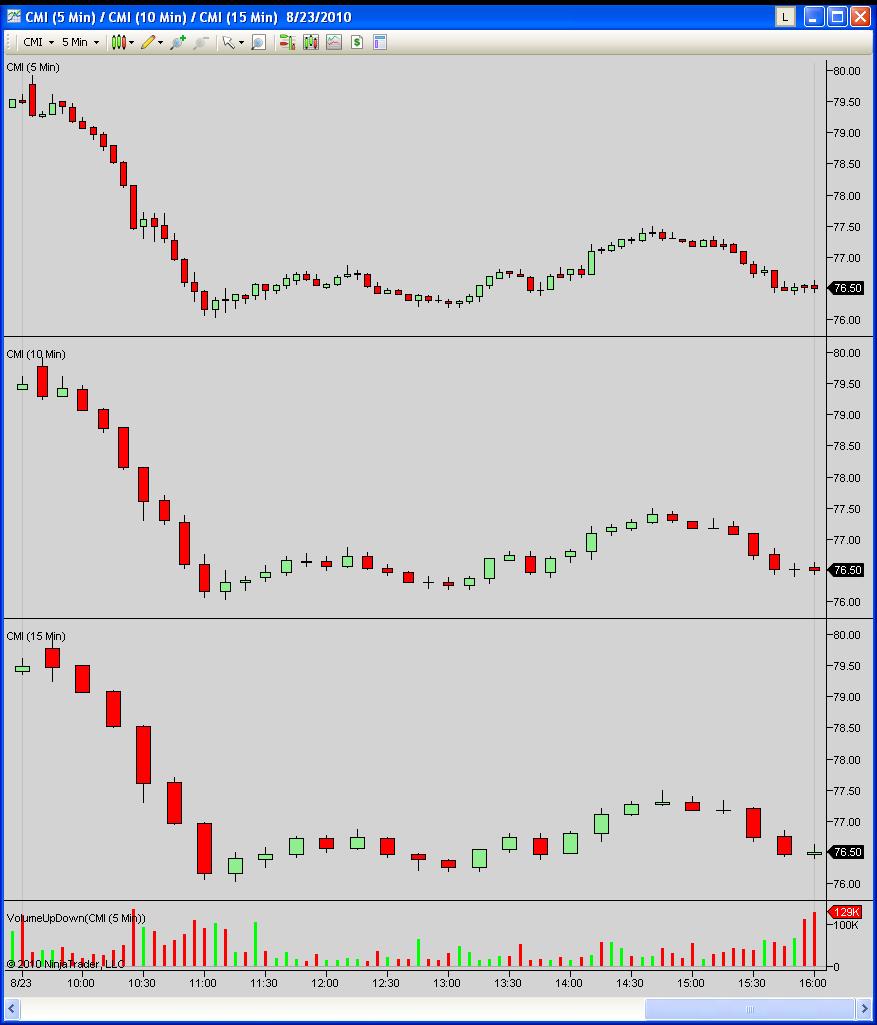
| i would have had a very tough time trading this today. looks like a scalpers dream. looking at the 5 min actually annoys my brain. i love the 15 min charts. |
 |
| another beauty |

 |
| i was trying an experiment by buying TZA at the top of q's trading range, and then i was going to buy TNA at the bottom of the q's range. unfortunately, i timed it incorrectly and the range trade was done soon after i entered. TNA get me all excited so I bought some. The wrong thing to do, and the rookie thing to do. I was just playing around and wanted to see where it would go if I didn't care. no stops or anything. phew! that thing is a beast and a stock to stay away from. |
today, i just wasn't in the mood to trade. i guess for some reason, i am feeling like there is never opportunity so i try to do wacky stuff. in reality, i just need to be paitent and find these trades. they are there, i just need to wade through the b.s. to get to them. hopefully, i will get some nice sleep tonight. think happy thoughts like peter pan, and be ready to tackle the market again tomorrow.
 | |
| here is the purchase of TZA at the high of the q's range, right before it broke out and stopped me. pretty amusing. it just teaches me to stay away from these beasts unless you have a nice tight stop of .10 or .15 and some other factorys going for you. either moving averages, fib level, candle signal, gut belief. something. otherwise its not worth the risk |
You have some nice charts going on - TI?
ReplyDeleteThinking about the strategy I am using right now - it would not work very well on those types of charts. I like your 5/10/15 minute approach.
It seems though on nice charts that a relatively long wick on a smooth & strong moving stock is a high probability setup - trade against the wick. Or the change in candle heights: CVLT, SAFM, & CMI for that matter (if you could of been in on the first move of the day).
The problem is - always so easy to see it EOD. ^^
yeah, agreed going against the wick is the high probability move. the thing that gets me, is when it doesn't come back, those are rocket ships. i think i had made the comment on scotts blog and someone responded that "the most money is made on the surprise side of the trade". cvlt and safm came from $ gainers, the rest i believe from TI.
ReplyDeleteits all easy end of day but today i was just playing around not focused. tomorrow, and the rest of the week, i'm going to try to be on top of my game and follow the plan. lets see how it works out.