
SVNT shown up to with the 1min chart. I traded the 5min, which is below, but it is neat to see the great setup on the fastest time frame. I think we stocks are going bonkers, it is okay to drill down time levels. The above is an excellent example. Doji'd then formed a rounded bottom and right back to the top again.
On this chart I can really see where I would have gotten in on the 5 and been stopped out. It looks like the 11:30 green baby hammer. The 15 though, keeps me out and it seems to keep me if the trend (if i would have traded it).

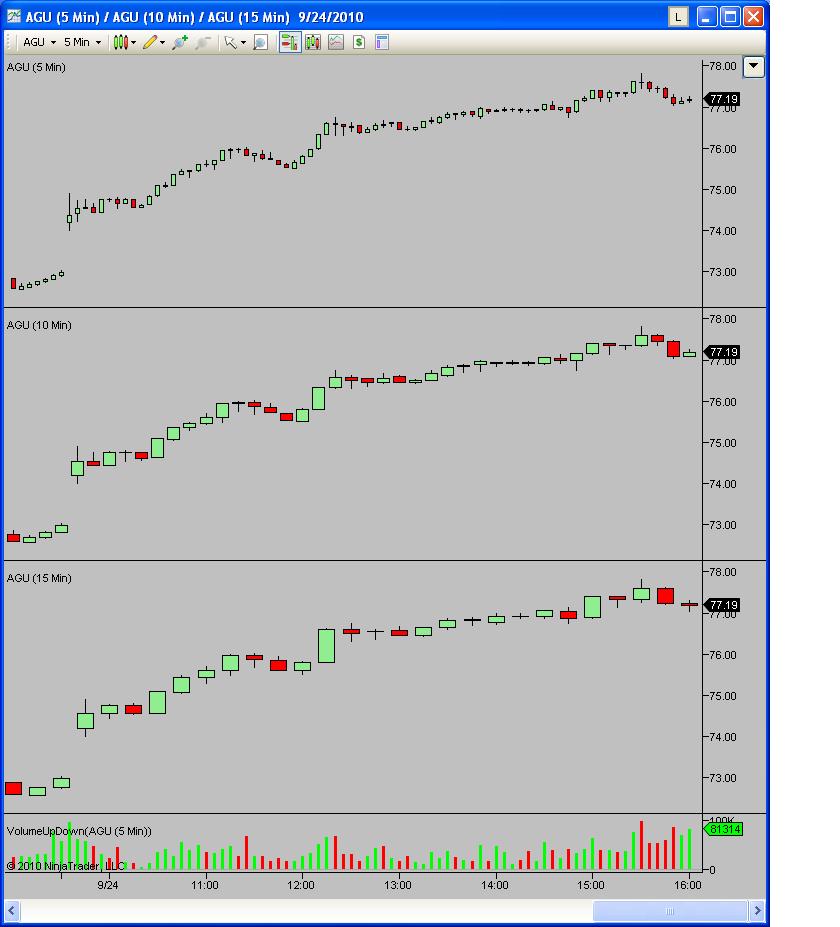
DTF pointed this one out to me. I think he may have even pointed out AGU. Both great patterns to remember. One a calm one, and one a crazy one.

Reflections of my old trades. This is one of those trades where I ask myself "What were you thinking?". The stock gaps up, is in a pure uptrend, doesn't really move violently up in order for me to make use of a doji and yet somehow, I thought a short would be good here. I don't think I have a chart of the q's up here tonight, but I sure hope they were turning over at this point. Otherwise, this is straight up an amateur trade. I think it is also jumping the gun. What has worked so well for me over the past few weeks is being patient. Waiting for the setup to present itself. Anticipating direction but waiting for confirmation before I pull the trigger. I think it actually helped coming in later as well. With the 15, at 11am there are only 6 candles. Not much to really base a trade on.

Same vein as APOL.

I shorted, doubled up and then covered on the 15 min doji. I believe I was thinking the market was strong. That the move I was playing was just a counter trend. And that it would return to highs. Now, it looks like a classic double top. I always miss those.

I was way late on NFLX. This stock is one I shouldn't even be touching unless there is an A++ setup. Not the case here. Glad to survive. As much dough as this stock rings out, I don't feel it's worth the risk.

I just realized in reviewing the FCX trade, this "trade" summary isn't very useful. I want to see the time of each trade. I may have to post executions instead.

I love this chart. I mean, I know it's strange, but when I see this chart I get tingly. It's crazy I know. But only you other stock nuts like me probably understand this feeling. It comes from the fact that the chart is so pretty, and works so nice. It's like, here is my edge. That's all I need. My edge is my ability to visualize, read and trade chart patterns that have a higher probability of going in my direction then not. It's as simple as that. My ability to be patient and wait for A+ setups is what sets me apart from other traders. This is the type of chart I look for and the only type of chart I should trade. I would like to add more weapons in my trading arsenal which is why I still like to experiment, but the above should be my main focus.

Not as violent as a move as I would like to see into a consolidation area, but it worked none the less.

I was trying to play the counter trend move here. I believe I may have been thinking the market would roll as well. Two things I need to remember: Try to trade with the trend. E.G. Instead of shorting SI, I should have been waiting through the pullback, and went long instead. (2) If I feel the market is going to roll over, don't be trading the strongest stocks short, trade the weakest stocks short.
This was SVNT move on the 5 min:

Looking back I think Friday was a good learning day. I have worked out some good ideas and some things I need to write down and remember. It still is amazing to me that for the past week and half the same patterns are occurring day in and day out. I wonder at what point I will stop being amazed and just accept the fact that these charts were always there I just couldn't see them. It's like the damn Matrix, lol.
Good luck tomorrow!
No comments:
Post a Comment